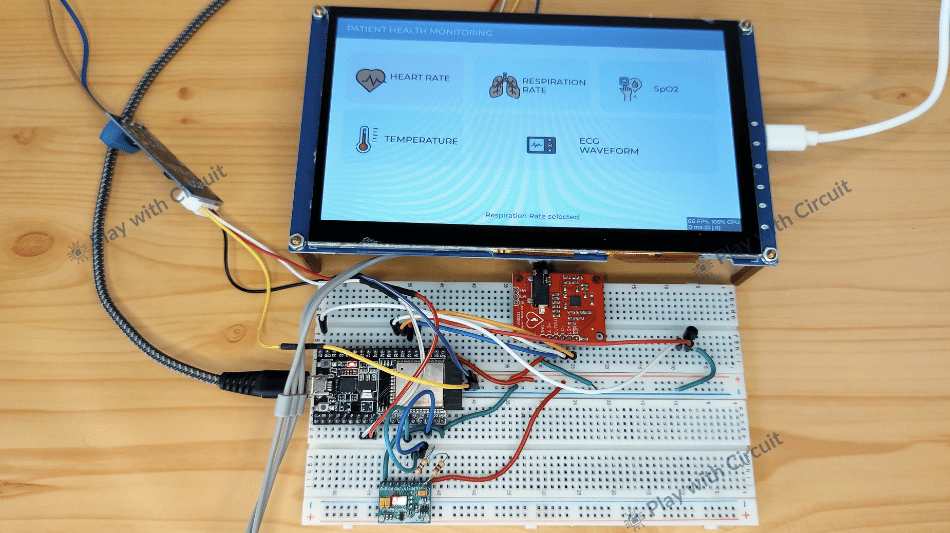
Modern patient health monitors provide healthcare professionals with a centralized view of a patient’s condition by displaying multiple vital parameters simultaneously. But have you ever wondered how such systems are built and how biomedical data is collected, processed, and displayed on an interactive screen?
In this project, we’ll build exactly that—a Health Monitoring System using ESP32, a 7-inch ESP32-P4 Smart HMI Display and 3 biomedical sensors. We will use the MAX30102 sensor to measure heart rate and estimate SpO₂, the AD8232 module to capture the ECG signal, and the LM35 to measure temperature. The ESP32 collects the sensor data and transmits it to the display through an RS485 communication link. The main screen displays the measured physiological parameters in an easy-to-read dashboard.
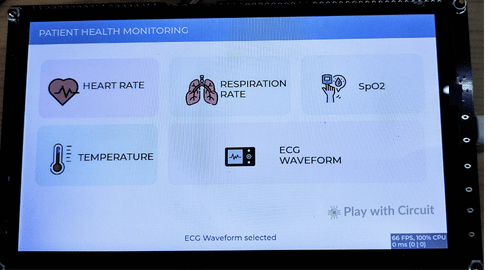
What makes it even more exciting is that we will use the LVGL graphics library to display all the parameters on the ESP32-P4 display. We will also explore the touchscreen functionality, where users can interact with the interface and select individual parameters. Touching a parameter opens its dedicated graph screen, allowing users to visualize how the readings change in real time. You can view the ECG waveform, observe heart rate, track SpO₂ variations, and monitor temperature changes through separate graphs.
Project Highlights
-
Multi-Parameter Monitoring: Integrates the MAX30102 for heart rate and estimated SpO₂, the AD8232 for ECG signal acquisition, and the LM35 for temperature sensing.
-
ESP32-Based Data Acquisition: ESP32 board collects sensor readings and prepares the data for transmission to the display.
-
RS485 Communication: Uses two TTL-to-RS485 converters to transfer sensor data between the ESP32 sensor unit and the display.
-
7-Inch Touchscreen Dashboard: Displays the monitored parameters on the ESP32-P4 Smart HMI Display.
-
Interactive Parameter Screens: Allows users to select individual parameters from the main dashboard and open dedicated graph screens.
-
Live ECG Waveform: Visualizes the ECG signal as a continuously scrolling trace.
-
LVGL-Based User Interface: Uses the LVGL graphics library to build the dashboard, display sensor values, render graphs, and support touchscreen navigation.
VIEWE ESP32-P4 Smart HMI Display Overview
The ESP32-P4 smart HMI Display is the main interface for our Health Monitoring System combines the high-performance ESP32-P4 processor with the ESP32-C6 wireless co-processor providing Wi-Fi 6 and Bluetooth connectivity for IoT applications. Its large 7-inch capacitive touch screen display provides sufficient space for displaying multiple widgets at the same time and its graphics capabilities provide smooth animations and responsive user interactions.
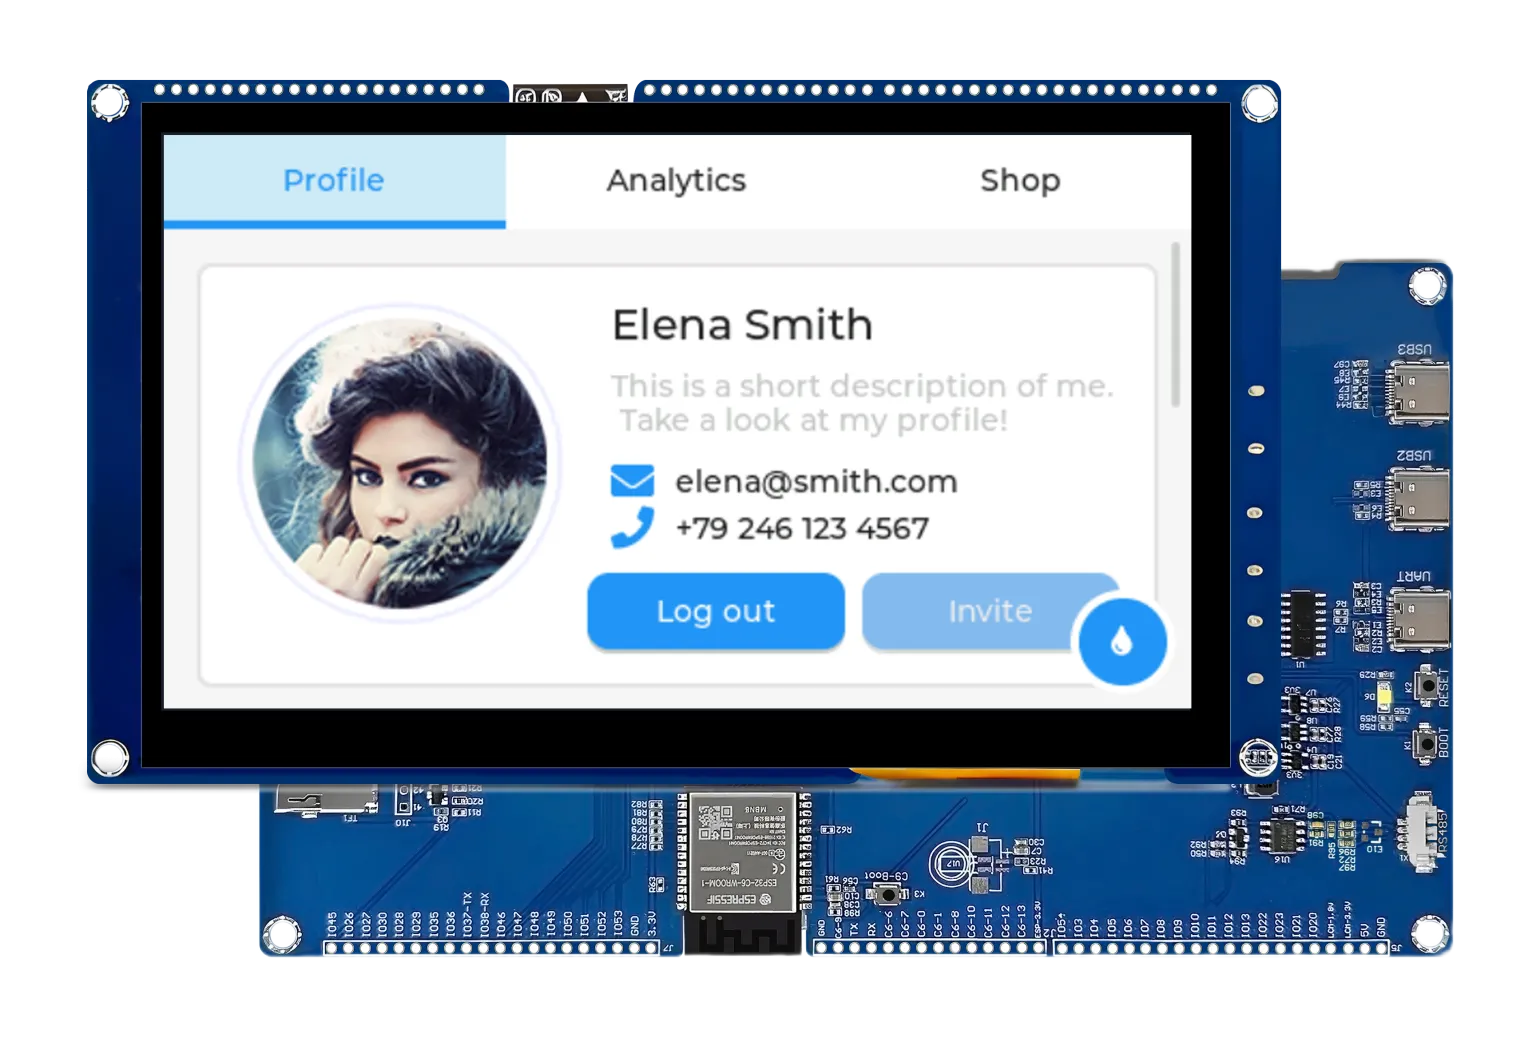
One of the biggest advantages of the ESP32-P4 Display is its native support for the LVGL (Light and Versatile Graphics Library) which enables you to design modern graphical interfaces. The display also offers a rich set of interfaces for industrial and embedded applications, including UART, I2C, SPI, USB OTG, GPIO expansion, audio support, and RS485 communication. These interfaces make it easy to integrate a wide range of sensors.
In this project, the display acts as a real-time medical monitoring dashboard, displaying heart rate, SpO₂, body temperature, ECG waveforms, and system status through an intuitive touch-enabled interface. Users can navigate between different dashboard pages, visualize biomedical signals, and access health analytics directly from the screen.
ESP32-P4 Display Key Features
- ESP32-P4: Dual-core RISC-V processor @ 400 MHz for high-performance HMI processing.
- ESP32-C6: Built-in Wi-Fi 6 and Bluetooth 5
- 7-inch MIPI-DSI IPS TFT Display: 1024 × 600 resolution for a large, detailed monitoring dashboard.
- Capacitive Touch: Multi-point touch for interactive navigation and controls.
- RS485 Interface: Direct RS485 communication with the ESP32 board.
- LVGL Support: Enables rich graphical dashboards, charts, buttons, and waveform displays.
- 32 MB PSRAM + 16 MB Flash: Ample memory for graphics, LVGL resources, and application firmware.
- USB Type-C: Used for power, programming, and debugging.
Why Use a Separate ESP32 for Sensor Data Acquisition instead of the Display’s Built-in Controller?
We can connect the sensors directly to the 7-inch ESP32-P4 Smart HMI Display and handle both sensor acquisition and visualization using its built-in controller. However, using a separate ESP32 creates a modular architecture in which sensor data acquisition operates independently of touchscreen interactions and graphical updates.
Using RS485, we can extend the design to connect multiple sensor-side units to one central HMI with suitable addressing and communication firmware. Also, sensor processing and display programming can be developed, tested, and updated separately, making the overall firmware easier to manage. The additional ESP32 is not strictly necessary, but it makes the system easier to organize, maintain, and expand in the future.
MAX30102 Pulse Oximeter Sensor
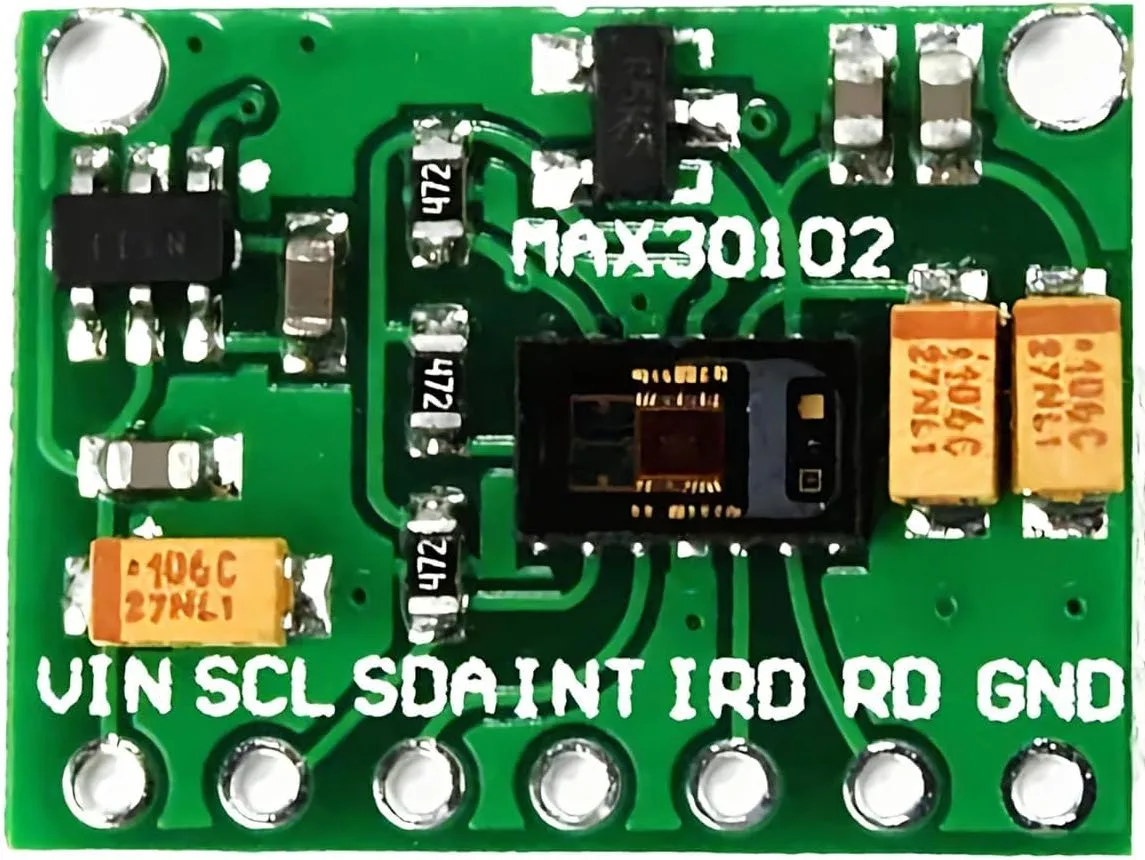
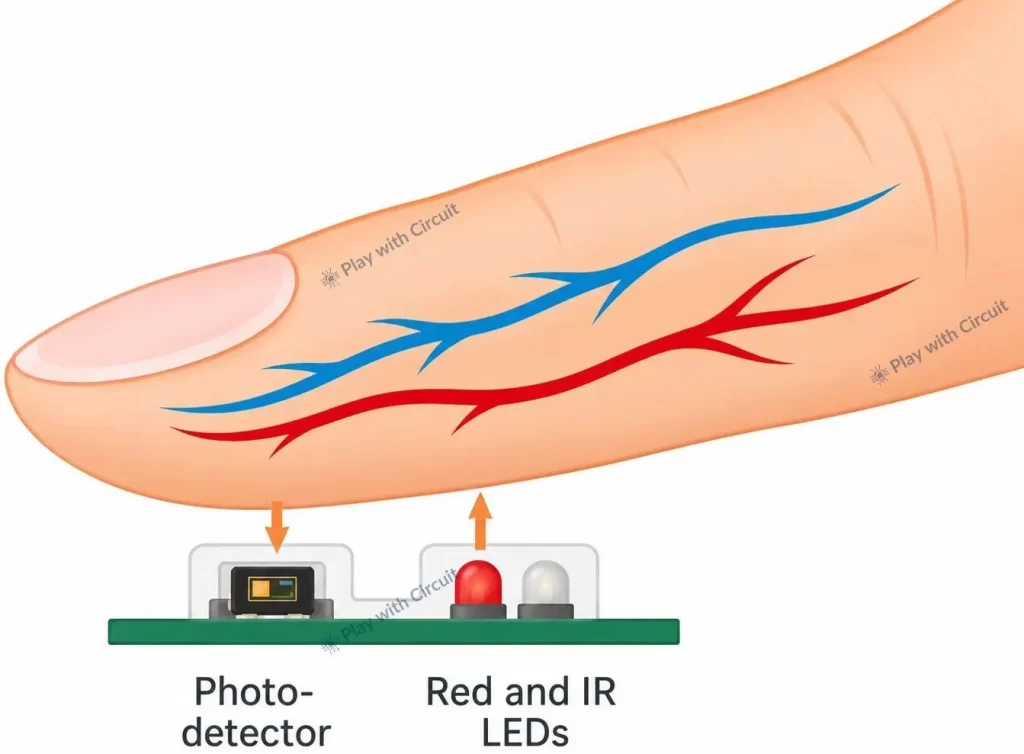
The MAX30102 is a bio sensor module used for measuring Heart Rate (HR) and Blood Oxygen Saturation (SpO₂). It has two LEDs- one red and one infrared (IR) LED, and a photodetector.
The sensor operates using a technique called Photoplethysmography (PPG), an optical method for measuring changes in blood volume using light.The sensor illuminates the fingertip (or earlobe) with red (660 nm) and infrared light (880 nm). As the light penetrates the skin some of it is absorbed by the blood, while the remaining light is reflected back. The reflected light is measured using a photodetector. Since the amount of reflected light changes with blood flow and blood oxygen levels, the MAX30102 can process these variations to measure both Heart Rate and Blood Oxygen Saturation.
Measuring Heart Rate
When the heart beats, it pumps a fresh pulse of blood through the arteries in your fingertip which temporarily increases blood volume in it. This increases the absorption of infrared light and reduces the amount of reflected light.
The MAX30102 continuously monitors the periodic changes in the reflected infrared light caused by the increase and decrease in blood volume with each heartbeat. By detecting these repeating changes, the sensor calculates the heart rate in beats per minute (BPM).
Measuring Blood Oxygen Levels (Pulse Oximetry)
To measure the oxygen level in your blood, the MAX30102 uses the fact that oxygenated and deoxygenated hemoglobin absorb light differently. Oxygenated hemoglobin absorbs more infrared light, whereas deoxygenated hemoglobin absorbs more red light. By comparing the relative absorption of these two lights, the sensor calculates the Blood Oxygen Saturation (SpO₂) level, which represents the percentage of hemoglobin carrying oxygen.
MAX30102 Specifications
| Feature | Specification |
|---|---|
| Interface | I2C |
| I2C Address | 0x57 |
| Sensor ADC Resolution | 18-bit |
| Operating Voltage | 1.8 V core supply; 3.3 V LED supply at chip level |
| SpO₂ Reference Range | 95%–100% for many healthy adults at sea level |
AD8232 ECG Sensor Module
The AD8232 ECG sensor measures the electrical activity of the heart. The heart generates small electrical impulses that travel through the cardiac muscles, causing them to contract and pump blood in the body. The AD8232 detects these low-amplitude electrical signals generated during each heartbeat and produces an Electrocardiogram (ECG) waveform- a graphical representation of the heart’s electrical activity. By analysing the ECG waveform, healthcare professionals can assess heart rate, heart rhythm, and the heart’s overall electrical function, helping detect abnormalities that may require further medical evaluation.
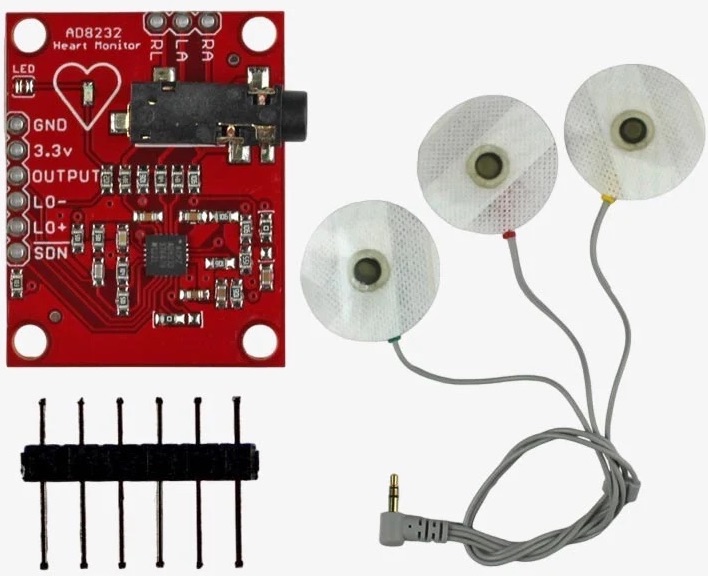
The AD8232 sensor uses three electrodes placed on the body to capture these low-amplitude signals. Since ECG signals are extremely weak and highly susceptible to electrical interference, body movement, and muscle activity, the module has a high-gain instrumentation amplifier, signal conditioning circuitry, and filters that amplify the desired ECG signal while suppressing unwanted noise. This enables the module to produce a clean analog signal that can be sampled by a microcontroller and visualized as a real-time ECG waveform.
AD8232 ECG Sensor Module Specifications
| Feature | Specification |
|---|---|
| Operating Voltage | 3.3 V |
| Output Type | Analog ECG Signal |
| Lead Configuration | Single-lead, 3 electrodes (RA, LA, RL) |
| Lead-Off Detection | LO+ and LO− digital outputs |
| Shutdown Pin (SDN) | HIGH = Enabled |
| Interface | Analog Output + Digital Status Pins |
| Electrode Connection | 3.5 mm jack for biomedical electrode pads |
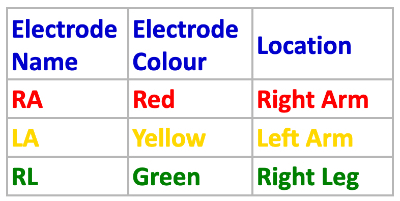
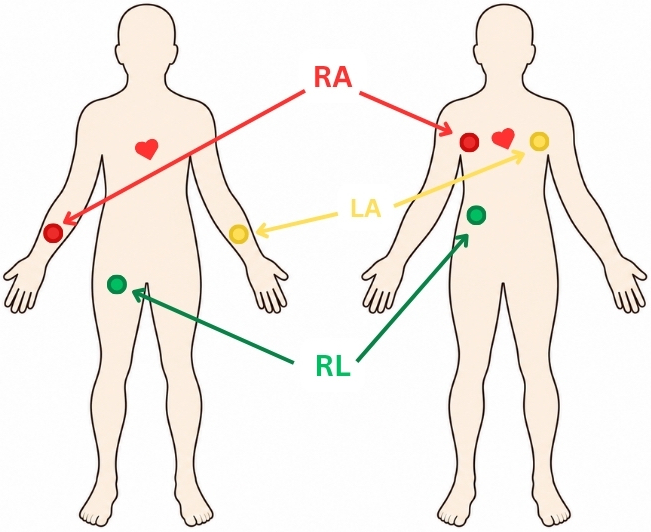
Electrode Placement
LM35 Temperature Sensor
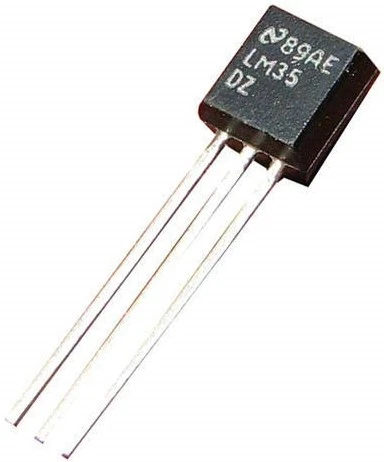
The LM35 is a precision analog temperature sensor that provides an output voltage directly proportional to temperature (°C). Unlike digital temperature sensors that communicate using protocols such as I2C or SPI, the LM35 produces a simple analog voltage that can be read by a microcontroller’s ADC. Its output has a linear scale factor of 10 mV/°C, which means the output voltage increases by approximately 10 mV for every 1°C increase in temperature.
LM35 Temperature Sensor Specifications
| Feature | Specification |
|---|---|
| Operating Voltage | 4 V to 30 V |
| Temperature Range | −55°C to +150°C |
| Output Type | Analog |
| Sensitivity | 10 mV/°C |
| Current Consumption | 60 µA (typical) |
TTL-to-RS485 Converter Module
A TTL-to-RS485 converter converts UART serial signals into differential RS485 signals, and vice versa. In this project, we use two TTL-to-RS485 converters to establish communication between the sensor-side ESP32 and the ESP32-P4 Smart HMI Display. The sensor-side ESP32 collects and processes readings from all the three sensors, then sends the data through its UART interface. The first converter converts the UART signals into differential RS485 signals, allowing the data to travel over the A and B communication lines with better resistance to electrical noise.
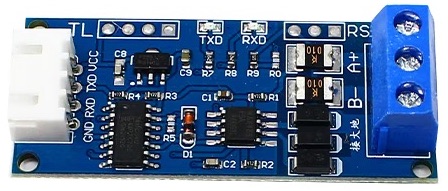
At the display side, the second converter converts the incoming RS485 signals back into UART signals that the HMI can receive and process. This allows the sensor readings to be transferred from the ESP32 to the display. We use this two-converter arrangement to provide a more noise-resistant communication link between the two units.
❕Note
Here, we are using RS485 communication instead of UART communication to demonstrate the system’s expandability. While UART can be used for communication between a single sensor-side ESP32 and the display unit, RS485 allows multiple target units, each monitoring a different patient, to communicate with a single display unit. This makes it possible to monitor multiple patients from one centralized interface without requiring a separate display for each patient.
Building the Patient Health Monitoring System
Now that we have explored the main components used in this project, let’s put everything together and build our Patient Health Monitoring System. We will connect the sensors to the ESP32 slave unit, establish RS485 communication between the slave and master units, and configure the ESP32-P4 Smart HMI Display to present the collected data. We’ll begin with the required hardware, understand how the system works, and then move on to the wiring connections for both units.
Hardware Requirement
| Component | Value | Qty. | Description | Buy Now |
|---|---|---|---|---|
| VIEWE ESP32-P4 Smart HMI Display | 7-inch, 1024 × 600 touchscreen | 1 | Acts as the controller monitoring interface. | VIEWE |
| ESP32 Development Board | ESP32 Devkit C | 1 | Main controller of the patient-side target unit. | Amazon |
| MAX30102 Sensor | Heart Rate & SpO₂ sensor, I²C | 1 | Measures Heart Rate and Blood Oxygen Saturation (SpO₂). | Amazon |
| AD8232 ECG Module and ECG Electrodes | Single-lead ECG front end | 1 | Captures the heart's electrical activity and provides an analog ECG waveform to the ESP32. | Amazon |
| LM35 Temperature Sensor | 10 mV/°C analog output | 1 | Measures temperature. | Amazon |
| TTL-to-RS485 Converter | TTL UART to RS485 | 2 | Converts the ESP32's UART signals into RS485 differential communication | Amazon |
| Resistor | 4.7 kΩ | 2 | I2C pull-up resistors used on the SDA and SCL lines of the MAX30102 interface. | Amazon |
| Breadboard | Standard solderless breadboard | 1 | Used to assemble and interconnect the ESP32, sensors, converter, and supporting components during prototyping. | Amazon |
| Jumper Wires | Male-to-male / Male-to-female | As required | Used to make the power, ground, signal, I2C, UART, and RS485 connections. | Amazon |
Software Requirements Controller Side
- Visual Studio Code, v1.144.0 or above.
- ESP-IDF extension in VS Code, v2.3.0 or above.
- ESP-IDF version installed using extension in VS Code, v5.5.5
- Python installed manually, v3.11.2
- Other dependencies, like the LVGL port (v9.2.3) for the display, are included in the source code package.
Software Requirement Target Side
- Arduino IDE, Version 2.3.9 or above installed on your PC.
- SparkFun_MAX3010x_Sensor_Library V1.1.2
How does the Health Monitoring System Work?
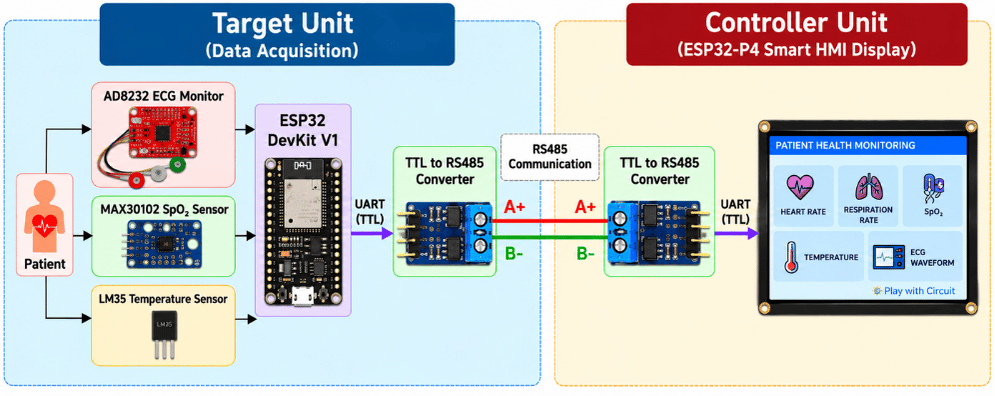
The system is divided into two main units: a target unit and a controller unit. The target unit collects the patient’s sensor data, while the controller unit receives this information and presents it through a graphical touchscreen interface.
On the target side, the MAX30102, AD8232, and LM35 are connected to an ESP32. The MAX30102 communicates with the ESP32 through I2C and provides the data required to determine Heart Rate and SpO₂. The AD8232 provides an analog ECG signal, which is sampled by the ESP32 through its ADC. The LM35 similarly provides an analog voltage corresponding to temperature. The ESP32 therefore acts as the central data-acquisition controller for the patient-side sensors.
After collecting the sensor readings, the target ESP32 sends the data through its UART interface to a TTL-to-RS485 converter. The converter converts the UART communication into an RS485 differential signal, which is transmitted over the RS485 A/B communication lines to the Controller unit. This allows the patient-side sensing circuit and the monitoring display to operate as separate units.
At the receiving end, the ESP32-P4 Smart HMI acts as the Controller. It receives the patient data through the RS485 interface, processes the incoming values, and updates the LVGL-based graphical user interface. The touchscreen dashboard is organized into different views for monitoring health parameters and viewing ECG waveforms.
This architecture separates data acquisition from data visualization. The target unit remains focused on collecting the patient’s sensor measurements, while the controller unit handles the user interface and presentation of the information.
Patient Health Monitoring Target Wiring
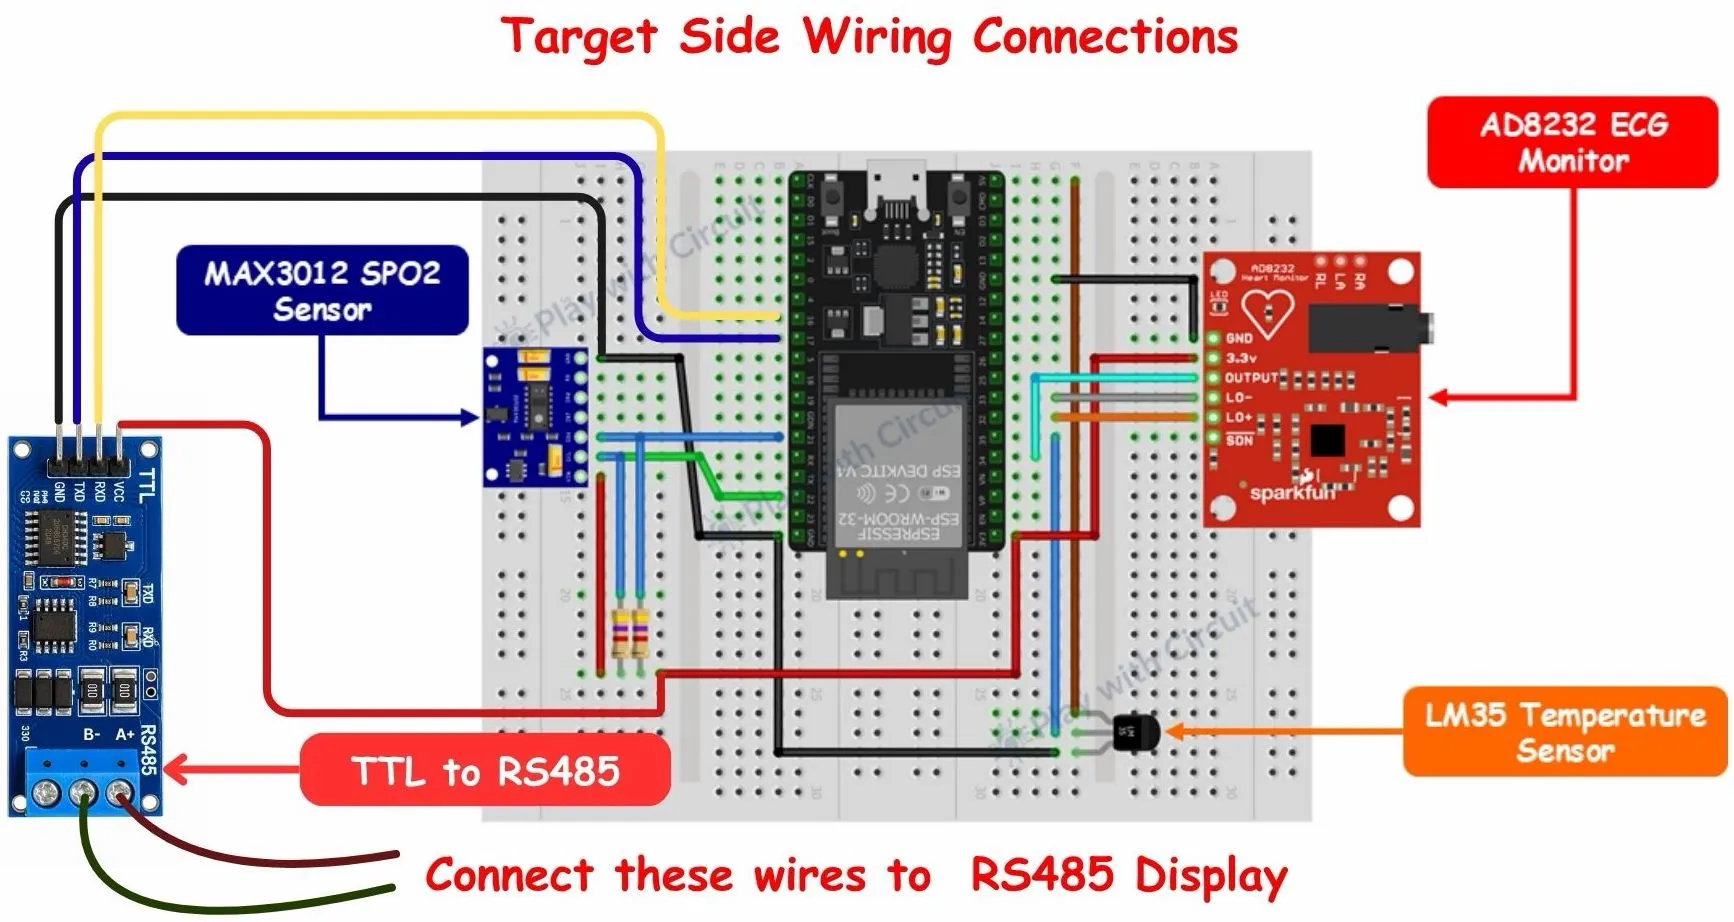
First, connect the MAX30102 sensor to the ESP32 using the I2C interface. Connect the sensor’s power and ground to the corresponding supply and ground of ESP32. The SDA and SCL lines are connected to the ESP32’s I2C pins. We are using two 4.7 kΩ pull-up resistors, with one connected between SDA and the 3.3 V supply and the other between SCL and the 3.3 V supply. These resistors provide the required pull-up for reliable I2C communication. The MAX30102 sends the optical measurement data to the ESP32, which uses it to obtain Heart Rate and SpO₂. In this project we will not use the heart-rate provided by the MAX30102 sensor. For heart rate we have a dedicated sensor AD8232.
| ESP32 | MAX30102 |
|---|---|
| 3.3V | Vin |
| GND | GND |
| GPIO_22 | SCL |
| GPIO_21 | SDA |
All other pins of MAX30102 which are not mentioned in the above table are neither connected to ESP32 nor pulled-up or pulled-down.
Note: Some MAX30102 breakout modules may have an I2C communication issue due to incorrect onboard pull-up voltage for the pull-up resistors. Normally, an I2C device should acknowledge communication and appear when scanned using an I2C address scanner. However, our module did not respond at its expected address, 0x57, or at any other address between 0x00 and 0x7F. After investigating the issue, we found that the onboard pull-up resistors for SDA, SCL, and INT were connected to the internal 1.8V regulator instead of the 3.3V supply rail.
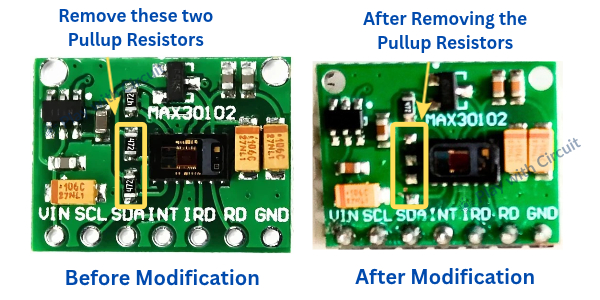
To resolve this issue, we removed the onboard pull-up resistors for SDA and SCL and added two external 4.7kΩ pull-up resistors between the respective lines and the 3.3V supply. Since we are not using the interrupt (INT) pin in this project, we left its onboard pull-up unchanged. After this modification, the MAX30102 was successfully detected and communicated with the ESP32 over I2C.
Next, connect the AD8232 ECG monitor to the ESP32. The module is powered from the ESP32 supply and shares the common ground. Its output pin is connected to an ESP32 ADC input to capture the analog ECG waveform. The LO+ and LO− pins are connected to GPIO pins for electrode lead-off detection. The RA, LA, and RL terminals of the AD8232 are used for the three ECG electrodes. This allows the ESP32 to acquire and process the patient’s ECG signal. Here SDN pin of AD8232 is not used.
| ESP32 | AD8232 |
|---|---|
| 3.3V | 3.3V |
| GND | GND |
| GPIO_34 | Output |
| GPIO_33 | LO- |
| GPIO_32 | LO+ |
The LM35 temperature sensor’s power and ground connections are connected to the appropriate supply and ground, while its Vout pin is connected to an ESP32 ADC input. The LM35 produces an analog voltage corresponding to the sensed temperature, which the ESP32 converts into a temperature reading.
| ESP32 | LM35 |
|---|---|
| 5V | Vcc |
| GND | GND |
| GPIO_35 | Out |
Finally, the ESP32 is connected to the TTL-to-RS485 converter. The converter’s VCC and GND are connected to the corresponding power and ground connections, while its TXD and RXD pins are connected to the ESP32’s UART Tx and Rx pins.
On the RS485 side of the converter, the A+ and B− terminals are connected to the corresponding RS485 lines going to the controller/display unit.
| ESP32 | TTL to RS485 |
|---|---|
| 3.3V | 3.3V |
| GPIO_16 | Rx pin |
| GPIO_17 | Tx pin |
| Gnd | Gnd |
Controller Side Wiring Connections
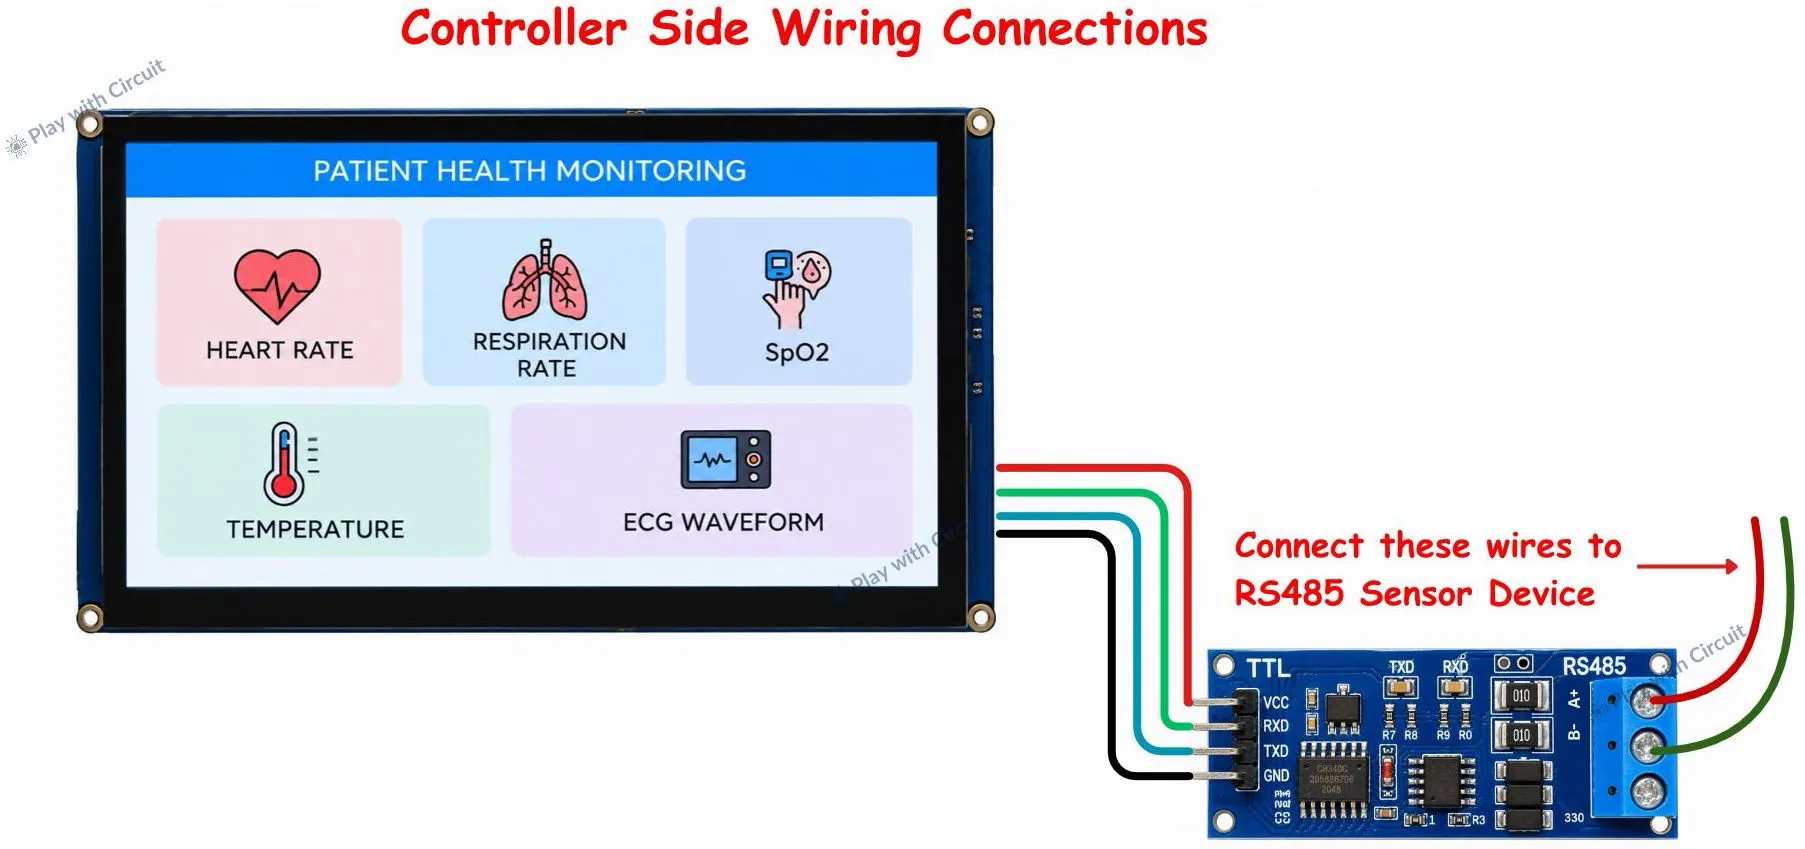
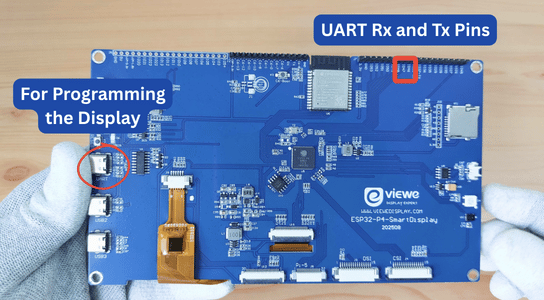
The ESP32-P4 display is connected to the TTL side of the RS485 converter using four connections: VCC, RXD, TXD, and GND. The display’s VCC is connected to the converter’s VCC pin to provide power, while the display’s GND is connected to the converter’s GND to establish a common reference. The following image shows the RS485 communication pins and the USB port for programming the ESP32-P4 display.
For serial communication, display’s TXD is connected to the converter’s TXD. Similarly, the display’s RXD is connected to the converter’s RXD.
On the other side of the converter, the A+ and B− terminals from the RS485 interface are connected to the corresponding A+ and B− lines of the RS485 device/network coming from the patient-monitoring target.
| ESP32 P4 display | TTL to Rs485 |
|---|---|
| 3.3V | 3.3V |
| GPIO_47 | Rx pin |
| GPIO_46 | Tx pin |
| Gnd | Gnd |
Patient Health Monitoring System Code
To make it easier to build this Patient Health Monitoring System, we have provided the complete source code in a single ZIP package. It includes both the sensor firmware and the display firmware, along with the required source files and supporting configurations.
The sensor code is developed using the Arduino IDE and runs on the ESP32 development board. The display code is developed using ESP-IDF in Visual Studio Code and runs on the ESP32-P4 Smart HMI Display.
The display project also contains separate files for different parameters, including heart rate, SpO₂, ECG, temperature, and respiration rate. These files handle the respective data and display functions. The main source file brings the different components together, including dashboard creation, graphical elements, and touchscreen interactions. We have also included the required configuration files, libraries, and supporting source files needed to build the project.
Download the package using the link below and extract it before proceeding with the installation and setup instructions.
How the Target Side ESP32 Code Works?
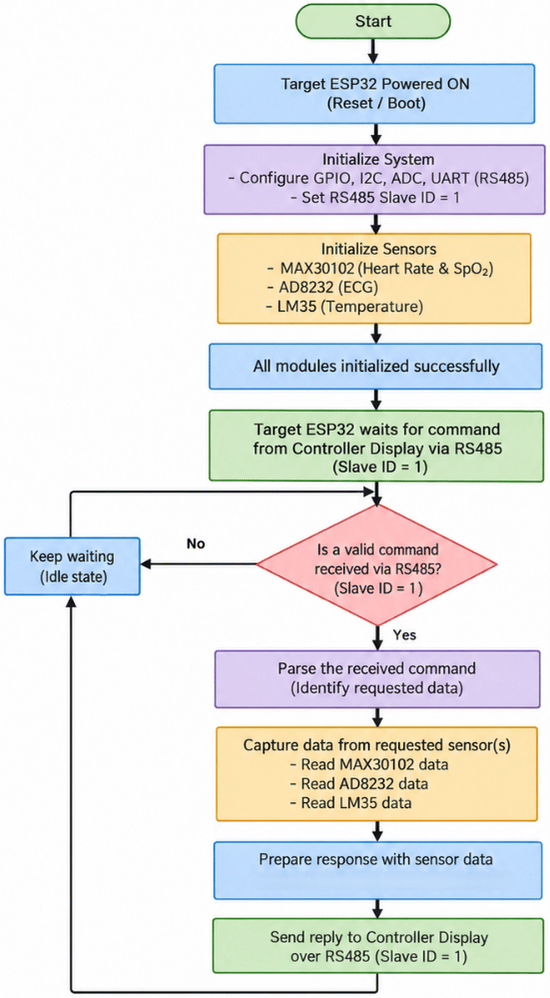
When the target-side EPS32 is powered on, all the three connected sensors MAX30102 , AD83232 and LM32 are first initialized. It also initializes the serial interface required for RS485 communication.
Now, the ESP32 waits for commands from the controller display. These commands are transmitted over the RS485 communication link using the predefined command-response protocol. The display sends a command containing the target device address and command code.
When a command is received, the target ESP32 checks the device address and command code to identify the requested parameter. It then reads or processes the corresponding sensor data and prepares a response in the defined data format.
Finally, the response is transmitted back to the ESP32-P4 display through the RS485 link, where the received data is processed and displayed on the monitoring dashboard.
This process continues repeatedly, allowing the display to request and receive updated sensor readings.
Command and Response format
Command Format
[Slave_Address] [Command]E.g., 01 F1
Response Format
[Slave_Address] [Command] [Status] [Response Data byte 1] …[Response Data byte n]The following table provides the command codes used in the project:
| Command | Measurement | Sensor/source | Response data |
|---|---|---|---|
| 0xF1 | Heart rate | AD8232 | 2 bytes, BPM × 10 |
| 0xF2 | Respiration rate | Estimated from AD8232 ECG | 2 bytes, breaths/min × 10 |
| 0xF3 | SpO₂ | MAX30102 | 1 byte, percentage |
| 0xF4 | Temperature | LM35 | 2 bytes, °C × 10 |
| 0xF5 | ECG waveform samples | AD8232 | 50 signed 16-bit samples |
How the Controller Side Code Works?
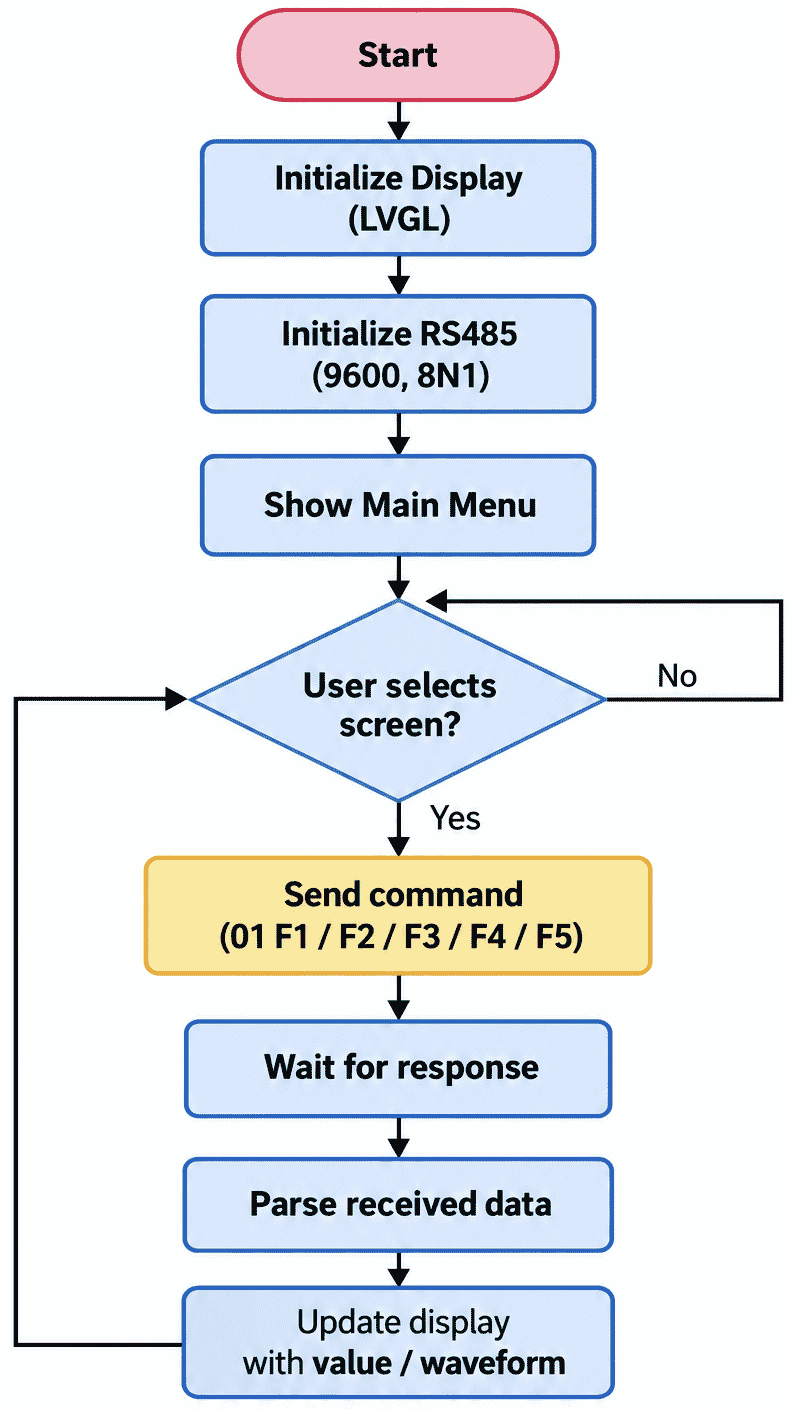
The ESP32-P4 display runs a user interface using LVGL and shows vital signs on different screens: Heart Rate, Respiration Rate, SpO₂, Temperature and ECG waveform.
To obtain sensor readings, the controller sends the corresponding command bytes over the RS485 communication link to the target-side ESP32. For example, when the heart rate screen is opened, the controller sends the command 0xF1 to request heart rate data.
The target-side ESP32 processes the request and sends the corresponding response back to the display. The controller then receives and parses the data before updating the value or waveform on the screen.
The controller also maintains a data buffer containing the readings collected over the last 60 seconds. This allows the user to view how individual parameters change over time.
This process enables the ESP32-P4 display to continuously request sensor data, update the dashboard, and provide an interactive monitoring interface.
Testing the Health Monitoring System
After completing the hardware connections and uploading the codes to the ESP32 sensor node and the ESP32-P4 display, power on the system. The ESP32-P4 initializes the LVGL interface and RS485 communication, then displays the main menu.
Select a measurement to open its dedicated screen and request data from the sensor node.
Monitoring Heart Rate Using the AD8232
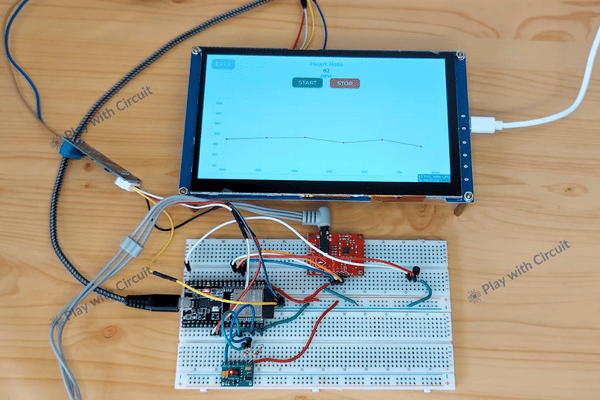
Connect the AD8232 ECG electrodes according to the module labels and ensure they have good skin contact. Open the Heart Rate screen on the ESP32-P4 display. Press the start button on screen. The P4 sends command 0xF1 to the Target ESP32 over RS485. The sensor node processes the AD8232 signal and returns the heart-rate value in BPM. The P4 decodes the response and updates the displayed value and graph.
Monitoring SpO₂ Using the MAX30102
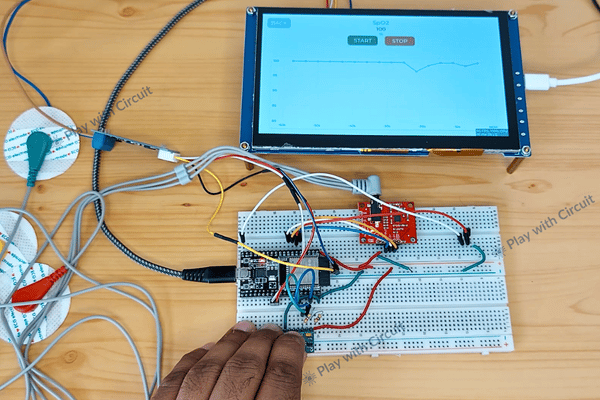
Place a finger gently over the MAX30102 optical sensing area. Keep the finger still and maintain consistent contact to reduce measurement errors caused by movement. Open the SpO₂ screen. Press the start button on screen. The P4 sends command 0xF3 over RS485, and the sensor node returns the estimated oxygen saturation as a percentage. The P4 displays the received value and updates the graph when valid sensor data is available.
Measuring Temperature Using the LM35
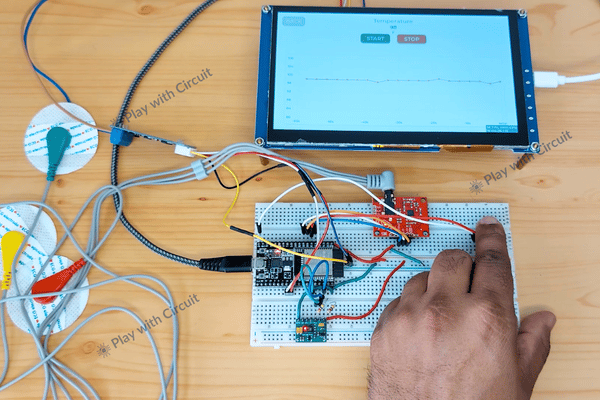
Firstly put your finger over LM35 temperature sensor. Then, tap the Temperature icon on the P4 display. Press the start button on screen. The P4 sends command 0xF4 to request the temperature reading, and the ESP32-WROOM-32E returns the measured temperature in degrees Celsius. Allow sufficient time for the sensor reading to respond to temperature changes. The screen updates temperature reading in Fahrenheit and displays graph.
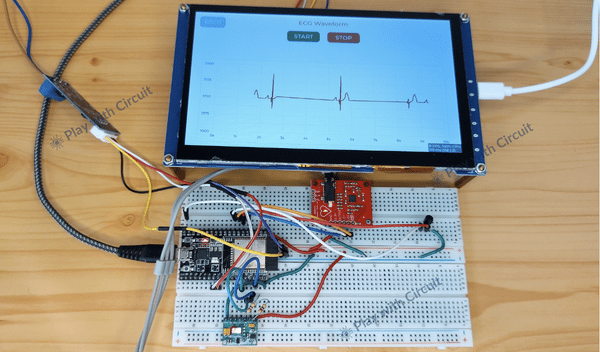
Displaying the ECG Waveform Using the AD8232
Connect the AD8232 electrodes according to the module labels: RA (right arm), LA (left arm), and RL (right leg), following the module’s instructions. Ensure proper electrode contact and open the ECG Waveform screen. Press the start button on screen. The P4 sends command 0xF5 to request ECG samples from the sensor node. The node returns the samples over RS485, and the P4 decodes them and updates the ECG graph.
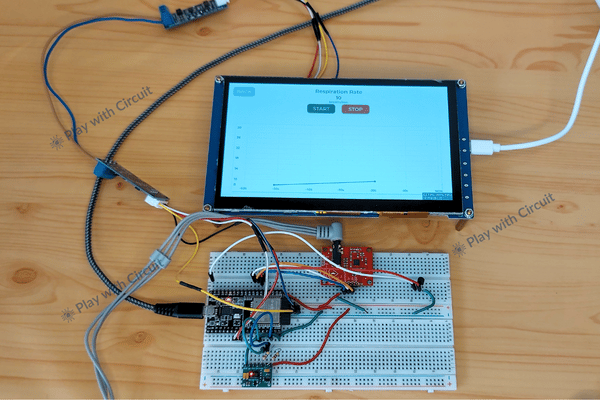
Monitoring Respiration Rate
Open the Respiration Rate screen to request data using command 0xF2. Press the start button on screen. The system estimates respiration rate from the AD8232 ECG signal and returns the result in breaths per minute(bpm). The respiration rate is not monitored via sensor, it is calculated from taking multiple readings from sensor AD8232 and finding respiration rate.
Disclaimer: This patient health-monitoring system is an educational prototype intended for demonstration and learning purposes only. Its sensors, algorithms, and measurements have not been clinically validated and must not be used for medical diagnosis or treatment decisions. Do not rely on its readings to assess your health or replace professional medical advice.
Project Video
Troubleshooting Guide
Issue 1: SpO₂ Readings are Unstable
Solution: Place your finger gently over the MAX30102 sensing area and keep it still. Ensure consistent contact and allow a few seconds for the readings to stabilize. Excessive movement or poor contact can affect the results.
Issue 2: LM35 Shows an Incorrect Temperature Reading
Solution: Check the LM35 power supply, GND, and analog output connection. Verify that the ESP32 ADC pin matches the code and that the conversion formula correctly converts the measured voltage into temperature.
Issue 3: ECG Waveform is Missing or Flat
Solution: Check the AD8232 power and GND connections, analog output pin, and ESP32 ADC configuration. Ensure that the RA, LA, and RL electrodes are connected correctly and have good skin contact. Also, verify that the firmware is reading and processing the analog ECG signal.
Issue 4: No Sensor Data Appears on the HMI Display
Solution: Check that both units are powered and running the firmware. Inspect the UART connections between each ESP32 and its TTL-to-RS485 converter, then verify the RS485 A/B connections between the two converters. Ensure that the baud rate and serial communication settings match on both sides.
Issue 5: Incorrect Values Appear on the Dashboard
Solution: Check the data format transmitted by the target ESP32 and the parsing logic on the HMI. Inspect the received serial data to identify incomplete or incorrectly interpreted messages.
Issue 6: Reading of a sensor is not showing even though all electrical connections are correct.
Solution: Try resetting the target ESP32 board by pressing the RESET button. Sometimes, the ESP32 may not initialize the sensors properly if the power supply is unstable during startup. Once the power supply is stable, pressing the RESET button allows the board to restart and initialize the connected sensors.
Issue 7: Graphs Open but do not Update
Solution: Confirm that the HMI is receiving new sensor data and that the graph-update function is being called. Check the data buffer, update interval, and LVGL graph or chart configuration.
Issue 8: HMI Display Freezes or Restarts
Solution: Check the power supply for instability and inspect the firmware for memory issues, blocking delays, or incorrectly handled serial data. Ensure that LVGL is updated according to its threading requirements and that sensor communication does not prevent the interface from refreshing.
Frequently Asked Questions
Why are two ESP32 boards used in this patient monitoring project?
The project separates sensor data acquisition from display management. One ESP32 connects to the sensors and collects their readings, while the ESP32-P4 Smart HMI handles the touchscreen interface, parameter cards, and graphs. This separation helps organize the firmware and demonstrates how sensing and visualization can operate as separate units.
Why is RS485 used instead of connecting the two ESP32 boards directly through UART?
UART is suitable for simple point-to-point serial communication, but RS485 provides differential signalling that is generally more resistant to electrical noise. RS485 also supports multidrop bus configurations, making it useful for future expansion to multiple sensor nodes. Each node would still need an addressing and communication protocol to ensure that the controller can identify its data.
Can multiple patient monitoring units connect to a single HMI display?
Yes. The system can be extended to support multiple sensor-side ESP32 units on a shared RS485 bus. However, the firmware must be modified to assign each unit a unique ID, organize data requests or transmissions, and display readings for the selected unit. The bus wiring, termination, and converter arrangement must also support the intended network.
Can blood pressure be measured using the existing sensors?
No. The MAX30102, AD8232, and LM35 do not directly measure blood pressure. Blood pressure would require an appropriate blood-pressure measurement system or a separately validated method.
Can this project display data on a mobile phone or a web dashboard?
Yes, with additional hardware configuration and firmware development. The ESP32 side or the HMI’s wireless subsystem could be used to transmit selected data to a mobile application, web dashboard, depending on the chosen architecture. This would require a suitable data-transfer protocol, interface, and security measures.
Can the system store sensor readings for later analysis?
Yes. Data logging can be added using a microSD card, external storage, or a network-connected database. The firmware would need to record timestamps and sensor values in a structured format, such as CSV, so the readings can be reviewed later or imported into analysis software.